Avanga Activity Module
As a company leader, you have loads of responsibility and are forever striving to optimize workflow. Monitoring employees tasks and having daily meetings can be exhausting, right? Nevertheless, you need to put the hard work in to stay on top of everything and analyze success rates to ensure business management optimization.
Just because you work a whole day, it doesn’t mean you’re productive. However, our tool helps workers to be more efficient and realize their potential. Here’s how:
Avanga's Activity module is an easy-to-use time-tracking tool. You can use it to generate simple online reports to show employees’ productivity and completed tasks. You can also use the module to track time by tasks, projects, and employees. The module estimates how you spend your time and also analyzes each team’s effectiveness.
Primary module functions
- Tracks time spent on each task and shows statistics;
- Shows working hours spent on projects;
- Shows team statistics;
- Shows total time per project and for all users;
- Statistics of individual user (user total time, total time per projects, diagrams and graphics);
- Total time per task (total time for all users).
Activity
By clicking on the Activity tab, the system displays the My Statistics panel for each user. Here you can choose the required time interval (“from...to” panel) and the chart will display total time (number of hours spent per week, month, or year) for all projects. If you are interested in a specific project, the “total time per project” panel will notify you.
My statistics panel
The platform operates using an RBAC (role-based access control) approach. This means that some users (for example, project managers) have more opportunities to control employee performance. Therefore, the Activity module has a wider range of functions. It consists of three sections:
Activity panel

My statistics
As previously mentioned, here you can view general reports for each project.
Users
In the Users section, you can view detailed statistics about each worker. By default, the system analyzes two information blocks: Total time per project and total time for these users.
Total time per projects and total time for these users
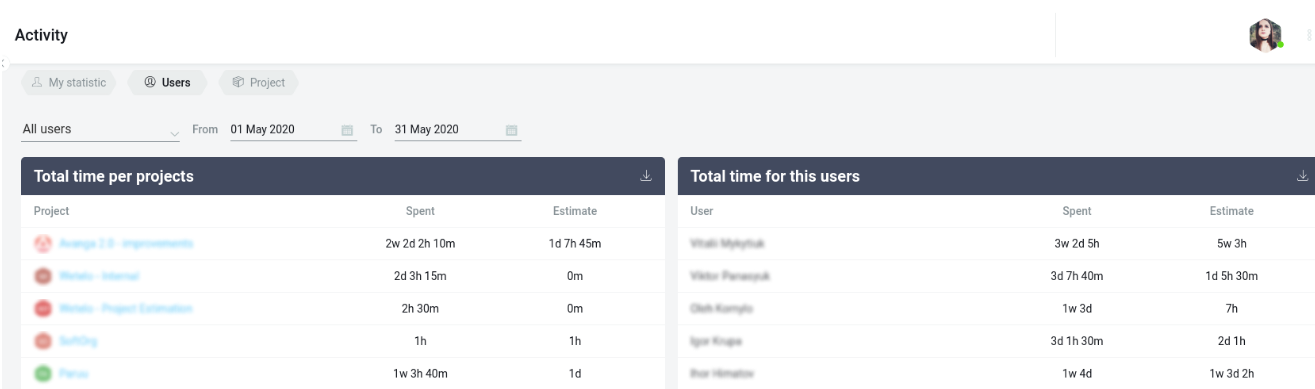
Total time per project shows a list of all projects, time already spent on development, as well as estimated time. These metrics allow you to compare data and detect if the team is hitting deadlines.
The total time for these users displays a list of all team members, the time they spend performing tasks, and the time estimated for completion of tasks.
All statistics can be downloaded immediately as a separate file by clicking the Download button in the upper right corner.
Want to get more info about each employee's productivity? We’ve made something special for you. Now, you can click on any employee and the system will redirect you to a separate window with detailed statistics about each user.
Detailed statistics per user
All data is collected and presented in the form of digital indicators. You can also review statistics shown in charts and graphs.
What can I analyse about employee activity?
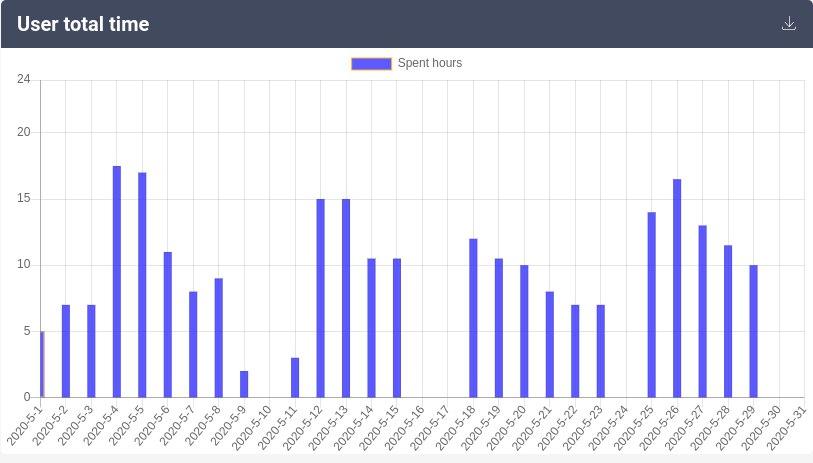
- User total time + graphs
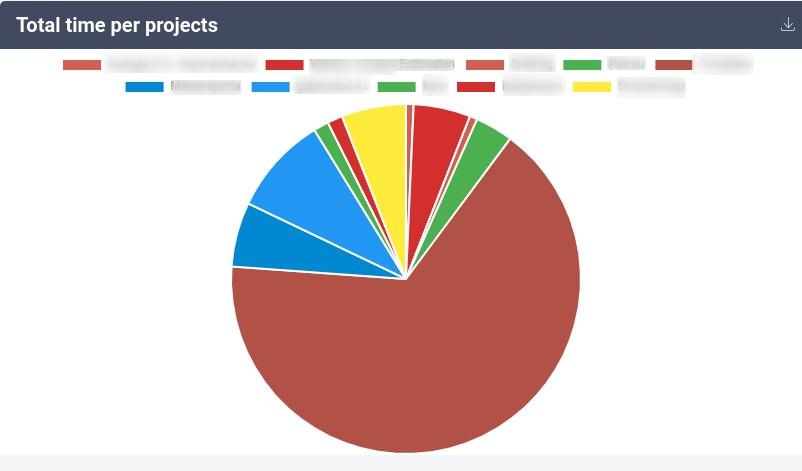
- Total time per projects + pie charts
Projects
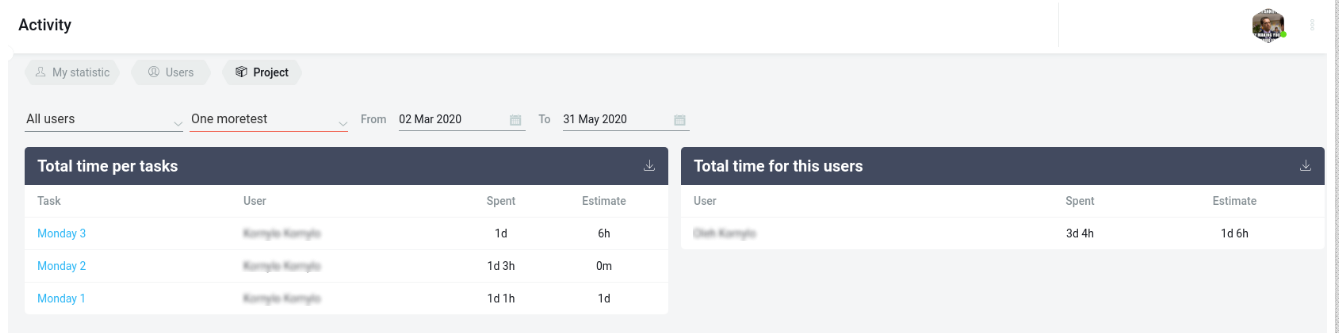
In this section, you can choose the project you are interested in and view detailed statistics. Each project is divided into tasks, so the module shows Total time per task and Total time for this user.
Total time per task and Total time for this user
Don’t forget that all statistics can also be downloaded to your computer by clicking the Download button in the upper right corner.
Stay tuned to explore more about new opportunities for your business. Write to us to learn more about how to track company progress using Avanga modules!